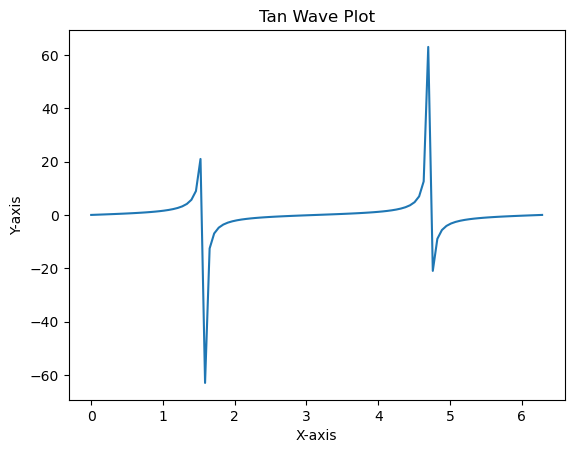
pyplot
# Import necessary libraries
import numpy as np
import matplotlib.pyplot as plt

# Generate some sample data
x = np.linspace(0, 2 * np.pi, 100)
y = np.tan(x)

# Create a plot
plt.plot(x, y)
plt.title('Tan Wave Plot')
plt.xlabel('X-axis')
plt.ylabel('Y-axis')

# Show the plot
plt.show()
